

Do trash cans actually make cities cleaner?
Surprisingly, the data says no

I spent the past week in Mexico City. And I couldn’t stop myself from eating. Street tacos, lattes, bakeries, candy from the convenience stores. I was walking 10+ miles a day, and I was hungry.
But when I was done eating, I could never find a bin. Mexico City (CDMX) has no trash cans. In fact, the last few bins were removed in 2019. (Allegedly to stop people from throwing out household trash in public.)
I’ve been to 52 countries. The only other place I can recall with a systemic lack of trash cans is Japan. Tokyo is a remarkably clean city, even despite the lack of bins. CDMX is no Tokyo, but the city felt far cleaner than places like New York City or San Fransisco, where bins aren’t particularly scarce.
This thought led me down a rabbit-hole: (1) Is it possible to model the relationship between the presence of trash cans and city cleanliness? And (2) if so, are trash cans a predictor of the cleanliness level of a city?
Getting the Numbers
I did what you do when a shower thought refuses to leave. I went looking for the data.
There is no global list of how many public bins a city has. Waste departments track tonnes collected and truck routes, not the number of baskets bolted to lampposts. So I built the list the slow way, one city at a time, from municipal reports, city open data, and local reporting. For each place, I took the reported number of public street bins and divided by the city’s central land area. That gives bins per square kilometer.
For cleanliness I used Numbeo’s crowd sourced “clean and tidy” score, which runs from 0 to 100. It is a perception measure, not a lab result, but it is the only cleanliness number that exists on the same basis for this many cities.
It took a lot of digging. Plenty of cities publish nothing usable, and some, like Tokyo, Osaka, and Fukuoka, publish no bin count at all because they barely run any public bins by policy. In the end I had 69 cities with solid figures.
Then I plotted them.
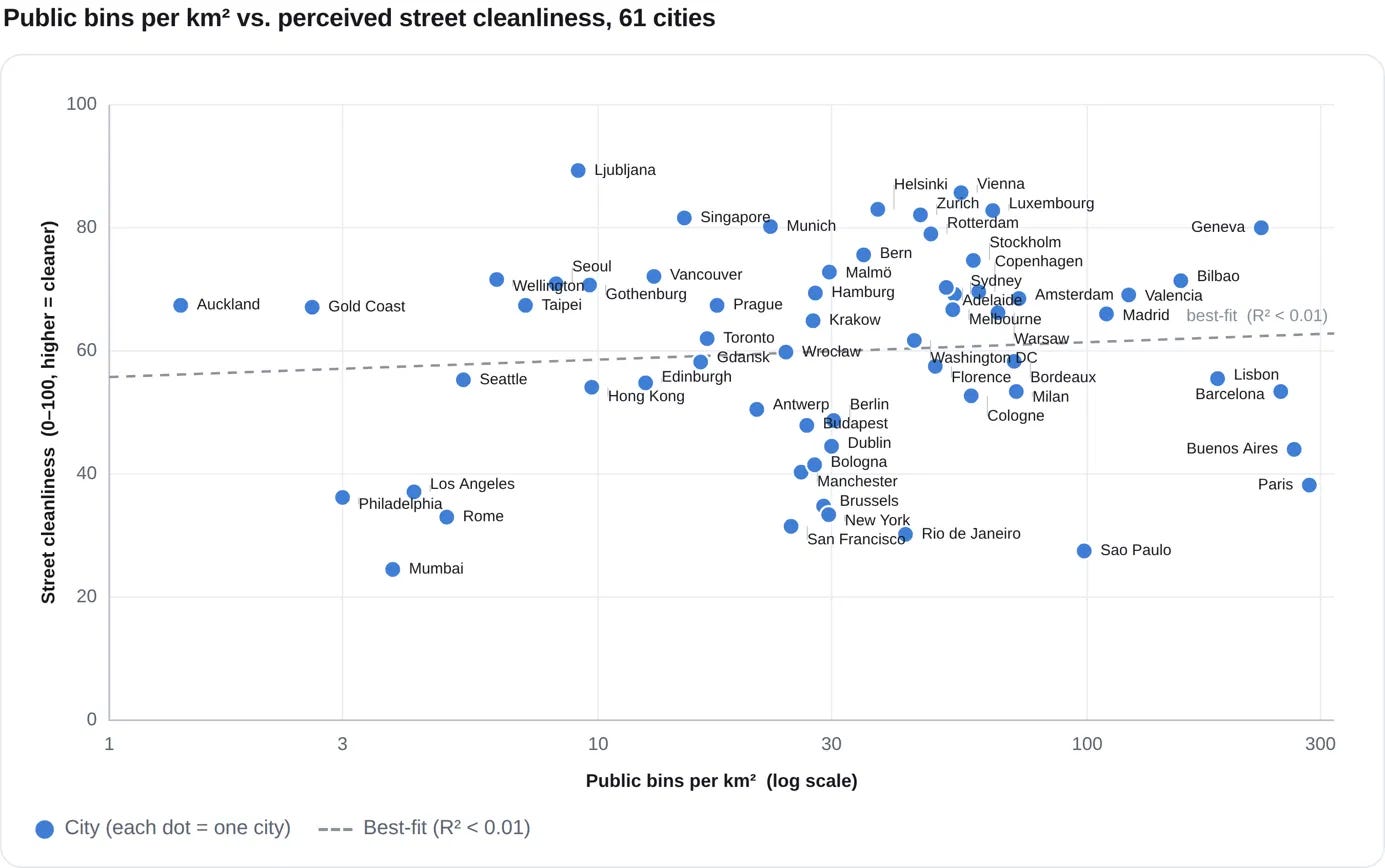
Look at the line of best-fit that was created by the data. It is remarkably horizontal.
Bin density explains under one percent of why one city is cleaner than another. It’s not just a weak effect, it’s essentially no effect. Cities with almost no bins land at the top and at the bottom. Cities drowning in bins do the same.
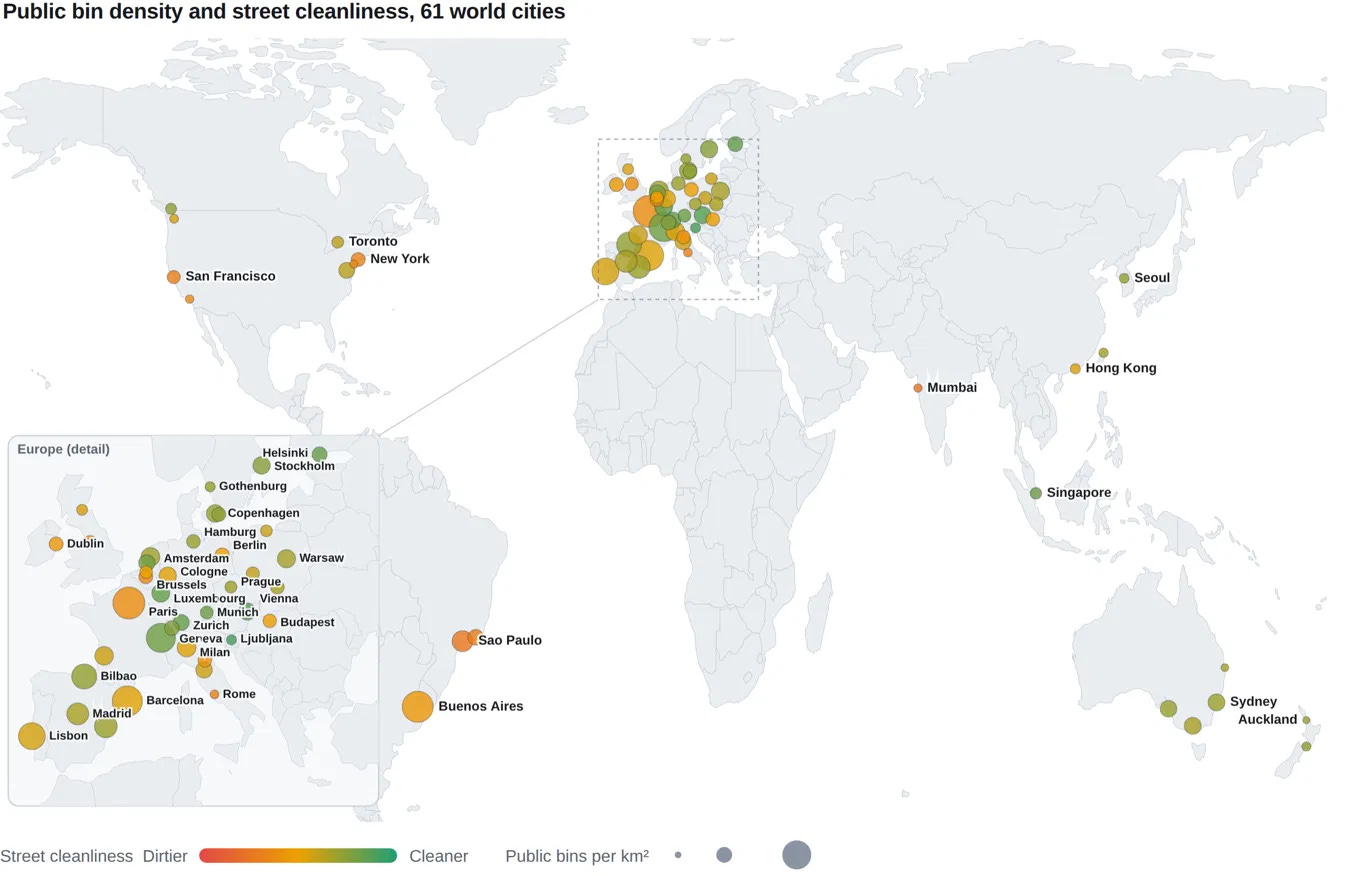
Put it on a map and the point gets even louder. Colour is cleanliness, size is bin density.
Look for a pattern between size and colour. There isn’t one. Big green Geneva sits beside big orange Paris, both packed with bins. Tiny Auckland glows green while tiny Mumbai burns red, and both run almost no bins at all. Clean cities and filthy cities turn up at every bin count.
Myth Busted
If bins made streets clean, a few cities should be impossible. Paris and Barcelona are the two most bin heavy places in the whole set, around 285 and 249 bins for every square kilometer, and both score in the 30s and 50s. New York and San Francisco carry a middling load of bins and score just as low. Whatever all that hardware is doing, it is not keeping the streets clean.
Auckland carries barely more than one bin per square kilometer and scores 67. Ljubljana and Singapore sit near the bin-less end of the scale and near the top for cleanliness. And then there is Mumbai and Rome, just as short of bins, but sitting near the bottom. Almost no bins can mean spotless streets or filthy ones. So can a city packed with them. The count simply does not decide the outcome.
One thing this cannot tell you is what happens when a city changes course. It is a snapshot. It measures the bins a city has today against the cleanliness it has today, so all it proves is that the current level does not predict the result. Rip every bin off the streets tomorrow and you might well create a mess, at least for a while. Add bins where litter is already winning and it might help. The number a city sits at is not what makes its streets clean. What moving that number would do is a different question, and this data does not answer it.
Don’t Start Ripping Out Bins, Yet
This data is only a snapshot. An account of how many bins exist today plotted against how clean these cities are today. The data does not reveal trends that only show themselves over time.
Take Tokyo. After the 1995 subway attack the city pulled its public bins for security and never brought them back. (The Aum Shinrikyo cult released sarin gas on the subway and the city decided a street bin was a convenient place to hide the next attack.) The streets stayed spotless, because people were already used to carrying their trash home, and that habit only hardened once the bins were gone.
London pulled its bins for much the same reason, clearing them out of the Underground and the mainline stations through the IRA bombing years, when devices kept turning up planted inside them. But Londoners had no habit of carrying litter home, so with nowhere to put it, the rubbish gathered on the platforms and the train floors and stayed there.
Rome went the other way. Its streets are a running scandal, garbage spilling out of overflowing containers, and the city has no habit of carrying trash home to fall back on. So for the 2025 Jubilee it did the opposite of Tokyo and London and flooded the streets with bins, adding more than 18,000 new ones to the 6,000 or so it already had. A city with the right habit can go binless and stay spotless. A city without one reaches for bins, because they are the only tool it has left.
The number of bins a city keeps is not what makes it clean, but changing that number can still have real consequences. So do not read the flat line as a reason to pull your bins. It tells you where cities stand today. It says nothing about what it costs to move.